ELK Stack End to End Practice
This chapter will demonstrate an end to end ELK Stack configuration demo for an imaginary production environment.
Production Enviroment
Environment
The production environment consists of 4 x ESXi servers, 1 x Unity and 1 x XtremIO:
- 4 x vSphere ESXi servers : 10.226.68.231-234 (hostnames: e2e-l4-0680-231/232/233/234)
- 1 x Cisco MDS FC switch : 10.228.225.202 (hostname: e2e-l4-sw7-202)
- 1 x Brocade FC switch : 10.228.225.203 (hostname: e2e-l4-sw8-203)
- 1 x Dell EMC Unity storage array : 10.226.49.236 (hostname : uni0839)
- 1 x Dell EMC XtremIO storage array : 10.226.49.222 (hostname : e2es-xio-02)
Monitoring Goals
- Consolidate all logs from servers, switches and storage arrays;
- Consolidate logs of ELK stack itself.
ELK Deployment
Environment
The ELK stack will be deployed on VMs:
- 3 x VMs for Elasticsearch cluster : 10.226.68.240-242 (hostnames: e2e-l4-0680-240/241/242)
- 1 x VM for Logstash installation : 10.226.68.186 (hostname : e2e-l4-0680-186)
Elasticsearch Deployment
The installation process has already been documented by this document, please refer to previous chapters. We will only list configurations and commands in this section.
Install Elasticsearch on all nodes;
Configs on each node (/etc/elasticsearch/elasticsearch.yml):
e2e-l4-0680-240
cluster.name: elab-elasticsearch
node.name: e2e-l4-0680-240
path.data: /home/elasticsearch/data
path.logs: /home/elasticsearch/log
network.host: 0.0.0.0
discovery.seed_hosts: ["e2e-l4-0680-240", "e2e-l4-0680-241", "e2e-l4-0680-242"]
cluster.initial_master_nodes: ["e2e-l4-0680-240", "e2e-l4-0680-241", "e2e-l4-0680-242"]
e2e-l4-0680-241
cluster.name: elab-elasticsearch
node.name: e2e-l4-0680-241
path.data: /home/elasticsearch/data
path.logs: /home/elasticsearch/log
network.host: 0.0.0.0
discovery.seed_hosts: ["e2e-l4-0680-240", "e2e-l4-0680-241", "e2e-l4-0680-242"]
cluster.initial_master_nodes: ["e2e-l4-0680-240", "e2e-l4-0680-241", "e2e-l4-0680-242"]
e2e-l4-0680-242
cluster.name: elab-elasticsearch
node.name: e2e-l4-0680-242
path.data: /home/elasticsearch/data
path.logs: /home/elasticsearch/log
network.host: 0.0.0.0
discovery.seed_hosts: ["e2e-l4-0680-240", "e2e-l4-0680-241", "e2e-l4-0680-242"]
cluster.initial_master_nodes: ["e2e-l4-0680-240", "e2e-l4-0680-241", "e2e-l4-0680-242"]
Start Elasticsearch service on each node:
systemctl disable firewalld
systemctl enable elasticsearch
systemctl start elasticsearch
Verify (on any node): 3 x alive nodes should exist and one master node is elected successfully
[root@e2e-l4-0680-240]# curl -XGET 'http://localhost:9200/_cluster/state?pretty'
  "cluster_name" : "elab-elasticsearch",
  "cluster_uuid" : "oDELRsi4QLi8NMH09UfolA",
  "version" : 301,
  "state_uuid" : "0oP2HuyWQyGUOxhr7iPr8A",
  "master_node" : "2sobqFxLRaCft3m3lasfpg",
  "blocks" : { },
  "nodes" : {
    "2sobqFxLRaCft3m3lasfpg" : {
      "name" : "e2e-l4-0680-241",
      "ephemeral_id" : "b39_hgjWTIWfEwY_D3tAVg",
      "transport_address" : "10.226.68.241:9300",
      "attributes" : {
        "ml.machine_memory" : "8192405504",
        "ml.max_open_jobs" : "20",
        "xpack.installed" : "true"
      }
    },
    "9S6jr4zCQBCfEiL8VoM4DA" : {
      "name" : "e2e-l4-0680-242",
      "ephemeral_id" : "vx_SsACWTfml6BJCQJuW4A",
      "transport_address" : "10.226.68.242:9300",
      "attributes" : {
        "ml.machine_memory" : "8192405504",
        "ml.max_open_jobs" : "20",
        "xpack.installed" : "true"
      }
    },
    "NR7jA8AeT3CuDvvNW3s3Eg" : {
      "name" : "e2e-l4-0680-240",
      "ephemeral_id" : "ZOrq8zUiRxavr1F5bzDvQQ",
      "transport_address" : "10.226.68.240:9300",
      "attributes" : {
        "ml.machine_memory" : "8192405504",
        "ml.max_open_jobs" : "20",
        "xpack.installed" : "true"
      }
    }
  },
  ......
Kibana Deployment
Kibana is the front end GUI for Elasticsearch. It won’t take part in data processing and it does not waste too much computing resouce, hence we can deploy it on the same node(s) as Elasticsearch clusters. Since we have 3 x nodes for Elasticsearch cluster, we can install Kibana on all of them. In other words, people can access the setup from any IP address - this will avoid single point of failure and leave us the potential to configure a front end load balancer for Kibana (e.g. with HAProxy).
The installation process has already been documented by this document, please refer to previous chapters. We will only list configurations and commands in this section.
Install Kibana on all Elasticsearch nodes;
Configure Kibana on each node (/etc/kibana/kibana.yml):
e2e-l4-0680-240
server.host: "0.0.0.0"
server.name: "e2e-l4-0680-240"
elasticsearch.hosts: ["http://e2e-l4-0680-240:9200", "http://e2e-l4-0680-241:9200", "http://e2e-l4-0680-242:9200"]
e2e-l4-0680-241
server.host: "0.0.0.0"
server.name: "e2e-l4-0680-241"
elasticsearch.hosts: ["http://e2e-l4-0680-240:9200", "http://e2e-l4-0680-241:9200", "http://e2e-l4-0680-242:9200"]
e2e-l4-0680-242
server.host: "0.0.0.0"
server.name: "e2e-l4-0680-242"
elasticsearch.hosts: ["http://e2e-l4-0680-240:9200", "http://e2e-l4-0680-241:9200", "http://e2e-l4-0680-242:9200"]
Start the service on each node:
systemctl enable kibana
systemctl start kibana
Verify: access http://<10.226.68.240-242>:5601 to verify that Kibana is up and running.
Logstash Deployment
The installation process has already been documented by this document, please refer to previous chapters. We will only list configurations and commands in this section.
Install Logstash on the prepared VM;
Configure Logstash settings (/etc/logstash/logstash.yml):
node.name: e2e-l4-0680-186
config.reload.automatic: true
Initial pipeline definitions (/etc/logstash/pipelines.yml):
- pipeline.id: syslog.vsphere
  path.config: "/etc/logstash/conf.d/syslog_vsphere.conf"
- pipeline.id: syslog.fabric
  path.config: "/etc/logstash/conf.d/syslog_fabric.conf"
- pipeline.id: syslog.unity
  path.config: "/etc/logstash/conf.d/syslog_unity.conf"
- pipeline.id: syslog.xio
  path.config: "/etc/logstash/conf.d/syslog_xio.conf"
- pipeline.id: beats
  path.config: "/etc/logstash/conf.d/beats.conf"
Configure pipelines:
syslog_vsphere.conf
input {
  tcp {
    type => "syslog"
    port => 5002
    tags => ["syslog", "tcp", "vsphere"]
  }
  udp {
    type => "syslog"
    port => 5002
    tags => ["syslog", "udp", "vsphere"]
  }
}

filter {
  grok {
    match => { "message" => "%{SYSLOGTIMESTAMP:syslog_timestamp} %{DATA:syslog_hostname} %{DATA:syslog_program}(?:\[%{POSINT:syslog_pid}\])?: %{GREEDYDATA:syslog_message}" }
    add_field => [ "received_from", "%{host}" ]
  }
  date {
     match => [ "timestamp", "MMM dd HH:mm:ss", "MMM  d HH:mm:ss" ]
  }
}

output {
  elasticsearch {
    hosts => ["http://e2e-l4-0680-240:9200", "http://e2e-l4-0680-241:9200", "http://e2e-l4-0680-242:9200"]
    index => "logstash-vsphere-%{+YYYY.MM.dd}"
    ilm_rollover_alias => "logstash-vsphere"
    ilm_policy => "cweek_policy1"
  }
}
syslog_fabric.conf
input {
  tcp {
    type => "syslog"
    port => 514
    tags => ["syslog", "tcp", "fabric"]
  }
  udp {
    type => "syslog"
    port => 514
    tags => ["syslog", "udp", "fabric"]
  }
}

filter {
  mutate {
    add_field => [ "received_from", "%{host}" ]
  }
}

output {
  elasticsearch {
    hosts => ["http://e2e-l4-0680-240:9200", "http://e2e-l4-0680-241:9200", "http://e2e-l4-0680-242:9200"]
    index => "logstash-fabric-%{+YYYY.MM.dd}"
    ilm_rollover_alias => "logstash-fabric"
    ilm_policy => "cweek_policy1"
  }
}
syslog_unity.conf
input {
  tcp {
    type => "syslog"
    port => 5000
    tags => ["syslog", "tcp", "unity"]
  }
  udp {
    type => "syslog"
    port => 5000
    tags => ["syslog", "udp", "unity"]
  }
}

filter {
  grok {
    match => { "message" => "%{SYSLOGTIMESTAMP:syslog_timestamp} %{DATA:syslog_hostname} %{DATA:syslog_program}(?:\[%{POSINT:syslog_pid}\])?: %{GREEDYDATA:syslog_message}" }
    add_field => [ "received_from", "%{host}" ]
  }
  date {
     match => [ "timestamp", "MMM dd HH:mm:ss", "MMM  d HH:mm:ss" ]
  }
}

output {
  elasticsearch {
    hosts => ["http://e2e-l4-0680-240:9200", "http://e2e-l4-0680-241:9200", "http://e2e-l4-0680-242:9200"]
    index => "logstash-unity-%{+YYYY.MM.dd}"
    ilm_rollover_alias => "logstash-unity"
    ilm_policy => "cweek_policy1"
  }
}
syslog_xio.conf
input {
  tcp {
    type => "syslog"
    port => 5001
    tags => ["syslog", "tcp", "xio"]
  }
  udp {
    type => "syslog"
    port => 5001
    tags => ["syslog", "udp", "xio"]
  }
}

filter {
  grok {
    match => { "message" => "%{SYSLOGTIMESTAMP:syslog_timestamp} %{DATA:syslog_hostname} %{DATA:syslog_program}(?:\[%{POSINT:syslog_pid}\])?: %{GREEDYDATA:syslog_message}" }
    add_field => [ "received_from", "%{host}" ]
  }
  date {
     match => [ "timestamp", "MMM dd HH:mm:ss", "MMM  d HH:mm:ss" ]
  }
}

output {
  elasticsearch {
    hosts => ["http://e2e-l4-0680-240:9200", "http://e2e-l4-0680-241:9200", "http://e2e-l4-0680-242:9200"]
    index => "logstash-xio-%{+YYYY.MM.dd}"
    ilm_rollover_alias => "logstash-xio"
    ilm_policy => "cweek_policy1"
  }
}
beats.conf
Notes: the output index must be set if the output destination is elasticsearch
input {
  beats {
    type => "beats"
    port => 5044
  }
}

output {
  elasticsearch {
    hosts => ["http://e2e-l4-0680-240:9200", "http://e2e-l4-0680-241:9200", "http://e2e-l4-0680-242:9200"]
    index => "%{[@metadata][beat]}-%{[@metadata][version]}-%{+YYYY.MM.dd}"
    ilm_rollover_alias => "filebeat"
    ilm_policy => "cweek_policy1"
  }
}
Start Logstash
/usr/share/logstash/bin/system-install
systemctl disable firewalld
systemctl enable logstash
systemctl start logstash
Data Source Configuration
vSphere Syslog Configuration
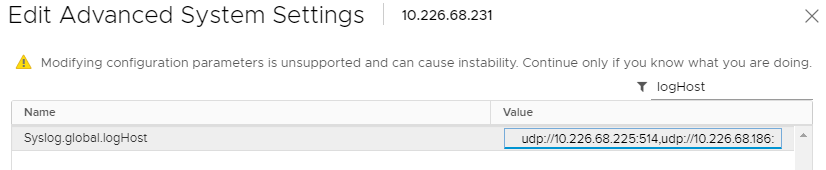
Select the vSphere ESXi server under vCenter;
Click “Configure->System->Advanced System Settings->EDIT”;
Find the option “Syslog.global.logHost”;
Add the Logstash syslog listening address “udp://10.226.68.186:5002”:
Notes:
- if the non-default port (514 is the default) is used, the corresponding ESXi firewall rule needs to be updated;
- For practice, ESXi firewall is disabled directly with command “esxcli network firewall set –enabled false” on our setup.
Switch Syslog Configuration
All network equipment, including Ethernet switches, FC switches, routers, firewalls, etc., support syslog as a kind of de facto standard. Therefor, their logs can be consolidated easily with ELK stack. However, most of network equipment uses UDP port 514 for syslog and does not provide the option to change it, hence we should create a Logstash pipeline listening at the port, just as what did above.
Note: the commands for enabling syslog on different switches may be far from each other. Please refer to their official documents for detailed commands.
Below are configurations for our switches (10.228.225.202/203):
Cisco Switch
conf t
logging server 10.226.68.186 6 facility syslog
end
copy running startup
Brocade Switch
syslogdipadd 10.226.68.186
syslogdipshow
Unity Storage Array Configuration
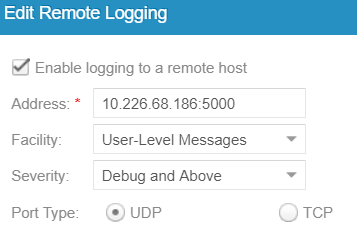
Login Unisphere of the storage array;
Click “Update system settings->Management->Remote Logging->+”;
Add the Logstash syslog listening address “10.226.68.186:5000”:
XtremIO Storage Array Configuration
Login Unisphere of the storage array;
Click “System Settings->Notifications->Event Handlers->New”;
Enable events should be forwarded to syslog and select “Send to Syslog”:
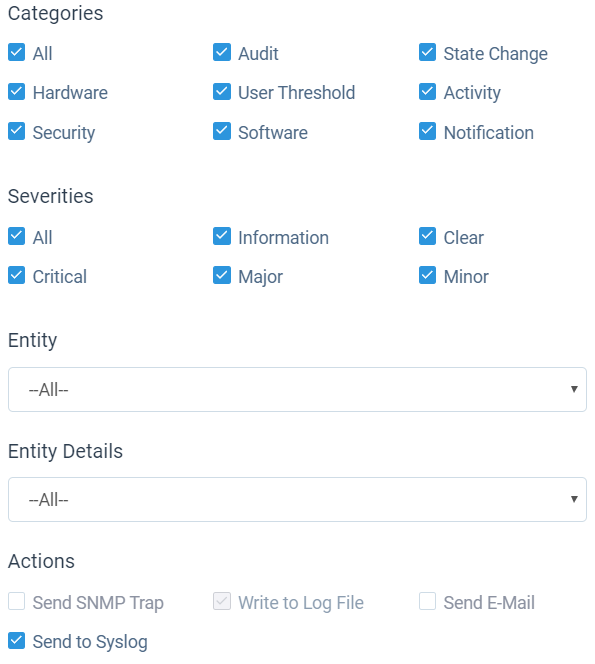
Click “Syslog Notifications->New” and specify the Logstash syslog listening address “10.226.68.186:5001”
ELK Stack Filebeat Configuraion
Since we are leveraging ELK stack mainly for logging here in the document, we will use filebeat only. Currently, filebeat supports Linux, Windows and Mac, and provide well pacakged binary (deb, rpm, etc.). The installation is pretty easy, we won’t cover the details, please refer to the offical instalaltion guide.
After installation, filebeat needs to be configured. The steps can be refered here.
Our target is monitoring ELK stack itself with filebeat. Since ELK stack consists of Elasticsearch cluster, Logstash and Kibana, and Kibana is only a GUI front end (with lots of features), we will only monitor Elasticsearch cluster and Logstash.
To make the daily configuration work more smoothly, filebeat provides a mechanism to simplify the collection, parsing, and visualization of common log formats, which is called modules (refer here for the introduction and supported modules).
Elasticsearch and Logstash have supported modules in filebeat, hence we will leverage them to ease the configuration:
Configure (/etc/filebeat/filebeat.yml) all nodes (e2e-l4-0680-240/241/242, e2e-l4-0680-186)
output.logstash:
  # The Logstash hosts
  hosts: ["e2e-l4-0680-186:5044"]
Enable modules:
Enable filebeat elasticsearch module on all Elasticsearch cluster nodes:
filebeat modules enable elasticsearch
filebeat modules list
Enable filebeat elasticsearch module on Logstash nodes:
filebeat modules enable logstash
filebeat modules list
Configure filebeat modules:
Elasticsearch nodes (/etc/filebeat/modules.d/elasticsearch.yml):
- module: elasticsearch
  server:
    enabled: true
    var.paths: ["/home/elasticsearch/log/*.log"]
  gc:
    enabled: false
  audit:
    enabled: false
  slowlog:
    enabled: false
  deprecation:
    enabled: false
Logstash nodes (/etc/filebeat/modules.d/logstash.yml):
- module: logstash
  log:
    enabled: true
  slowlog:
   enabled: true
Start filebeat
systemctl enable filebeat
systemctl start filebeat
Conclusion
We have completed all the setup work for the production environment. The next step is leveraging the powerful ELK stack checking our logs, which will be covered in a separate chapter.